Web Interface
A version of the web interface without neural network is available at https://flood-warning.herokuapp.com.
To run the web interface locally,
Set your Google Maps API key as an environment variable through
bash export API_KEY=<api_key>Install all the dependencies in
requirements.txt(a virtual environment is strongly recommended), then runbash plaidml-setup # set the device used for training bokeh serve main.py --port 5100
Alternatively, using Docker
bash docker build -t floodwarning .
docker run -it --rm -p 5100:5100 -e API_KEY floodwarning
Docker GPU pass through needs to be set according to the specific machine setup used, so it is set to train on the CPU by default. For better performance, run the code without using docker and choose an available GPU using
plaidml-setup.Go to
http://localhost:5100from your browser.
Map
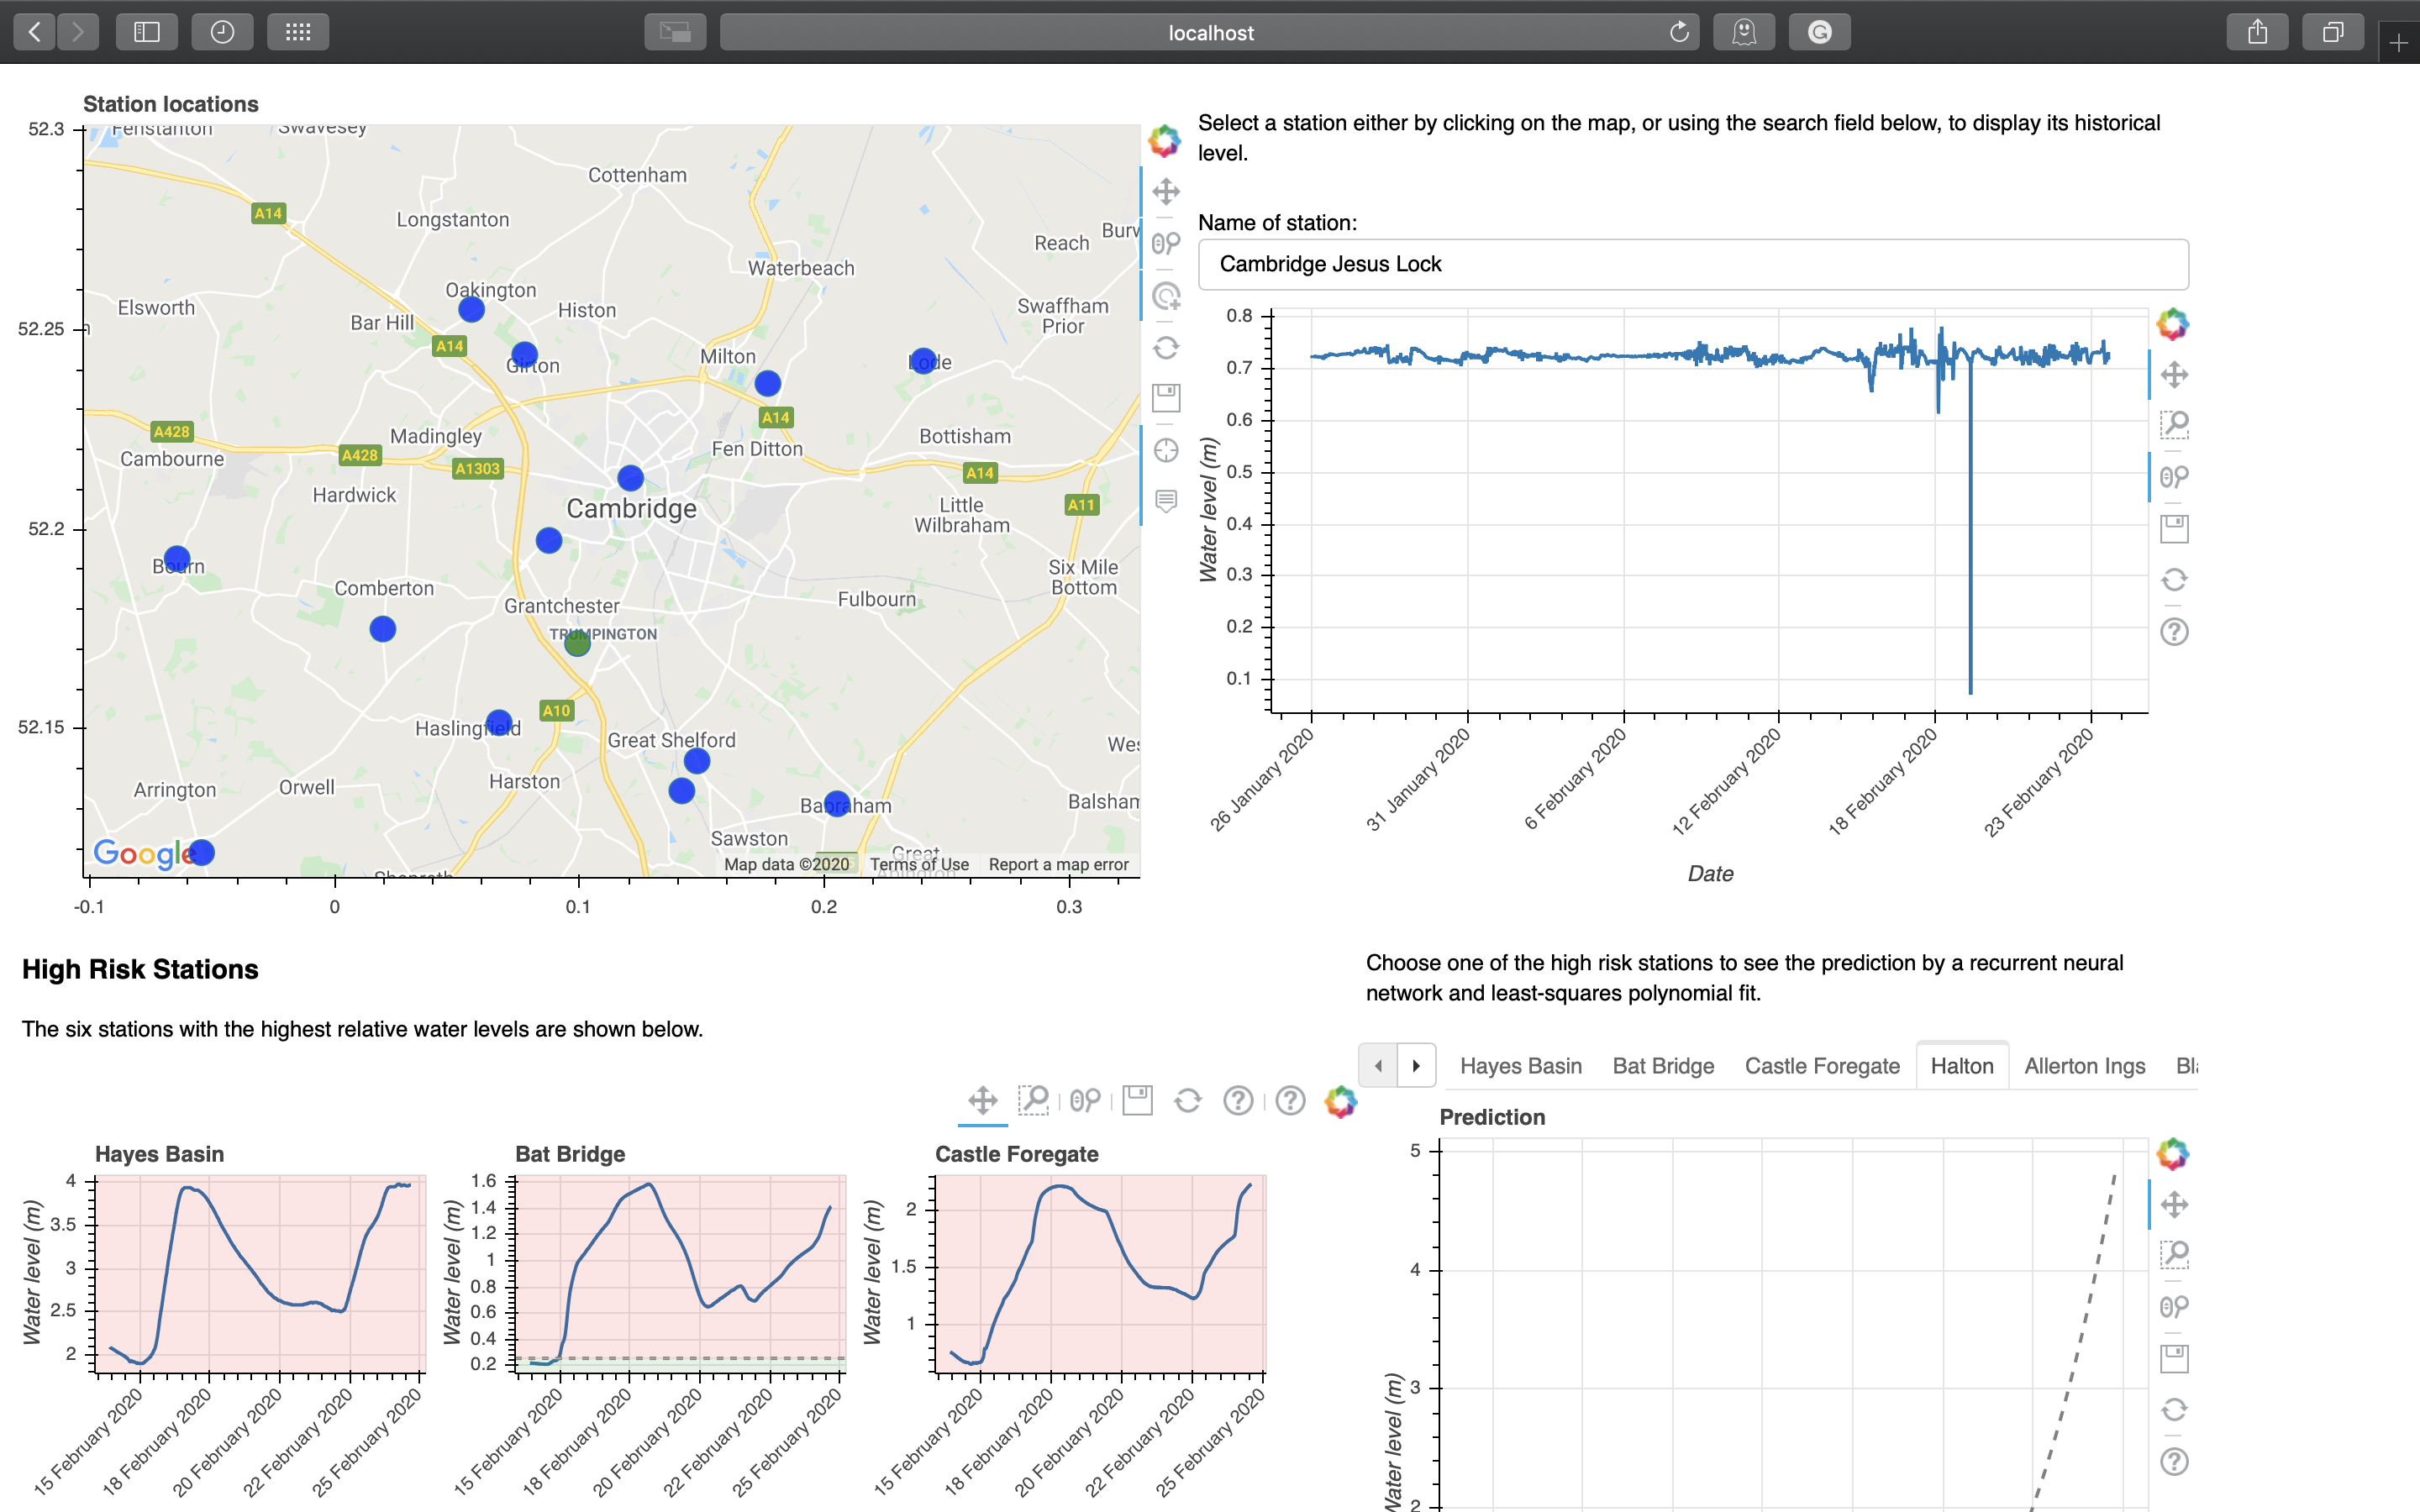
map
The colour of each point depends on the relationship between the latest water level of that station and its typical range. Hover tool is also implemented, showing useful information when the mouse hovers above a datapoint. Scroll wheel can be used to zoom in and out, and panning can be done by dragging.
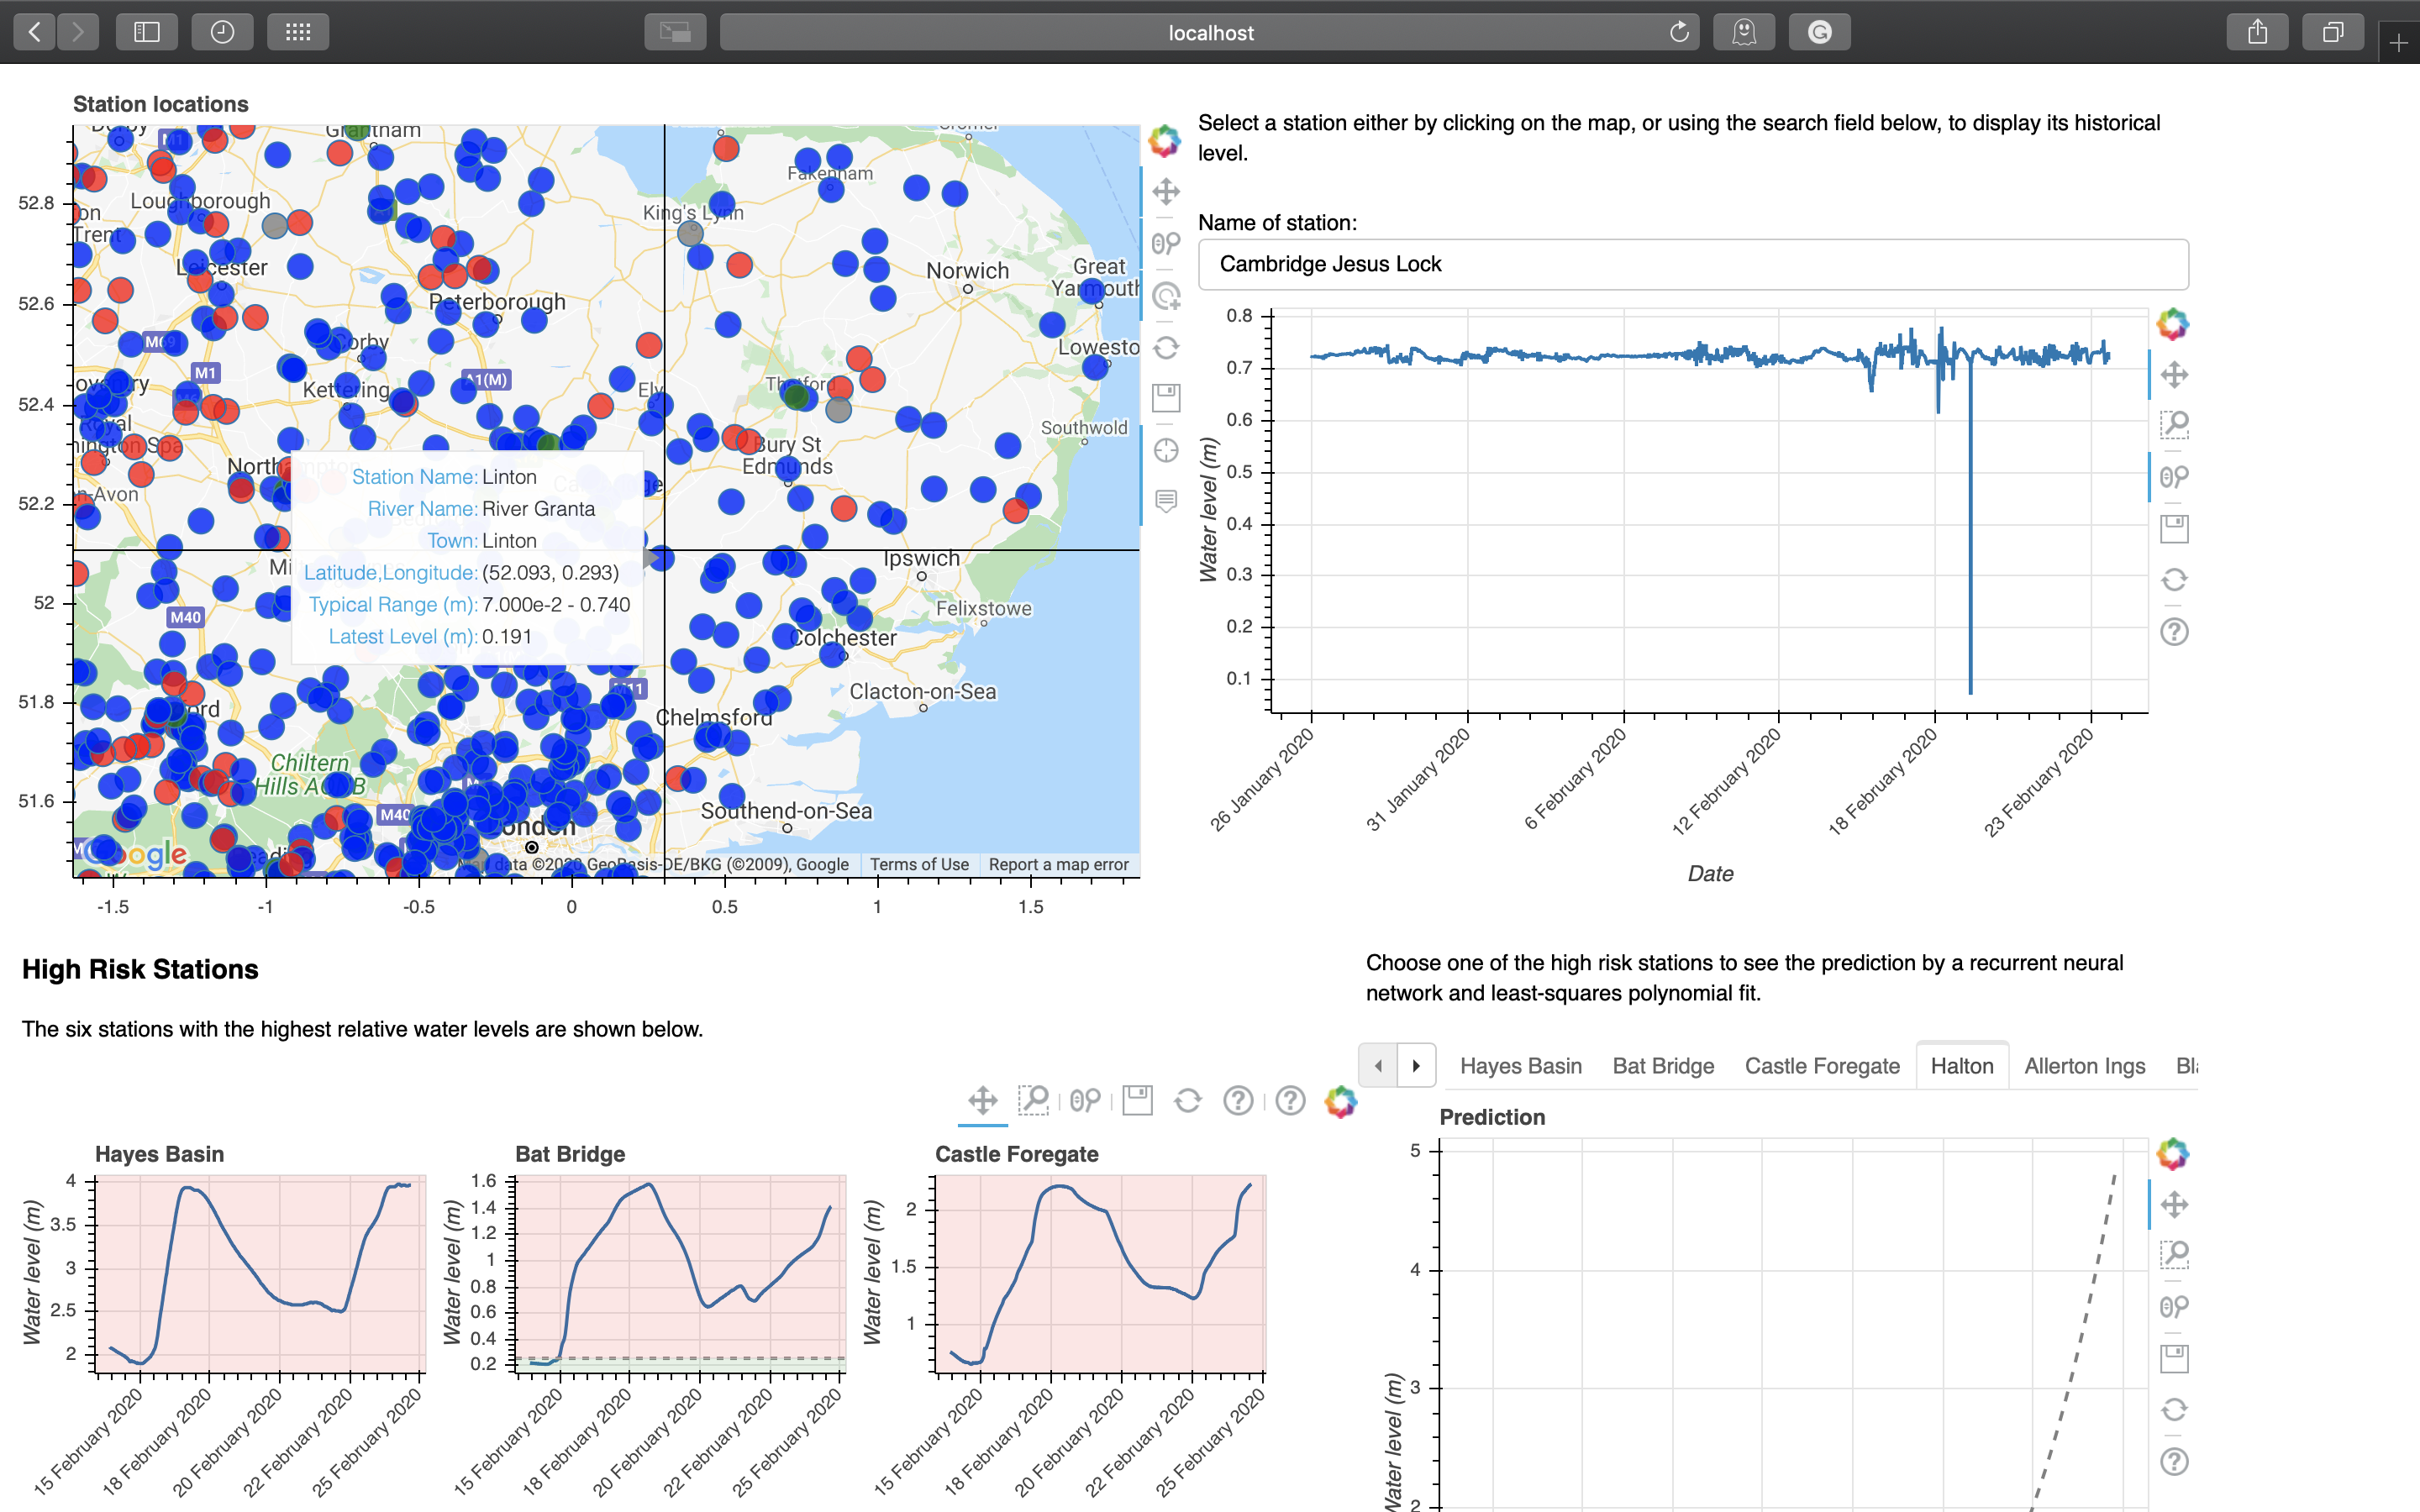
zoom_out
Stations can be selected to display its historical water level data either through clicking on the map or using the search box. Fuzzy matching is implemented for the search box. The selected station will be highlighted on the map.
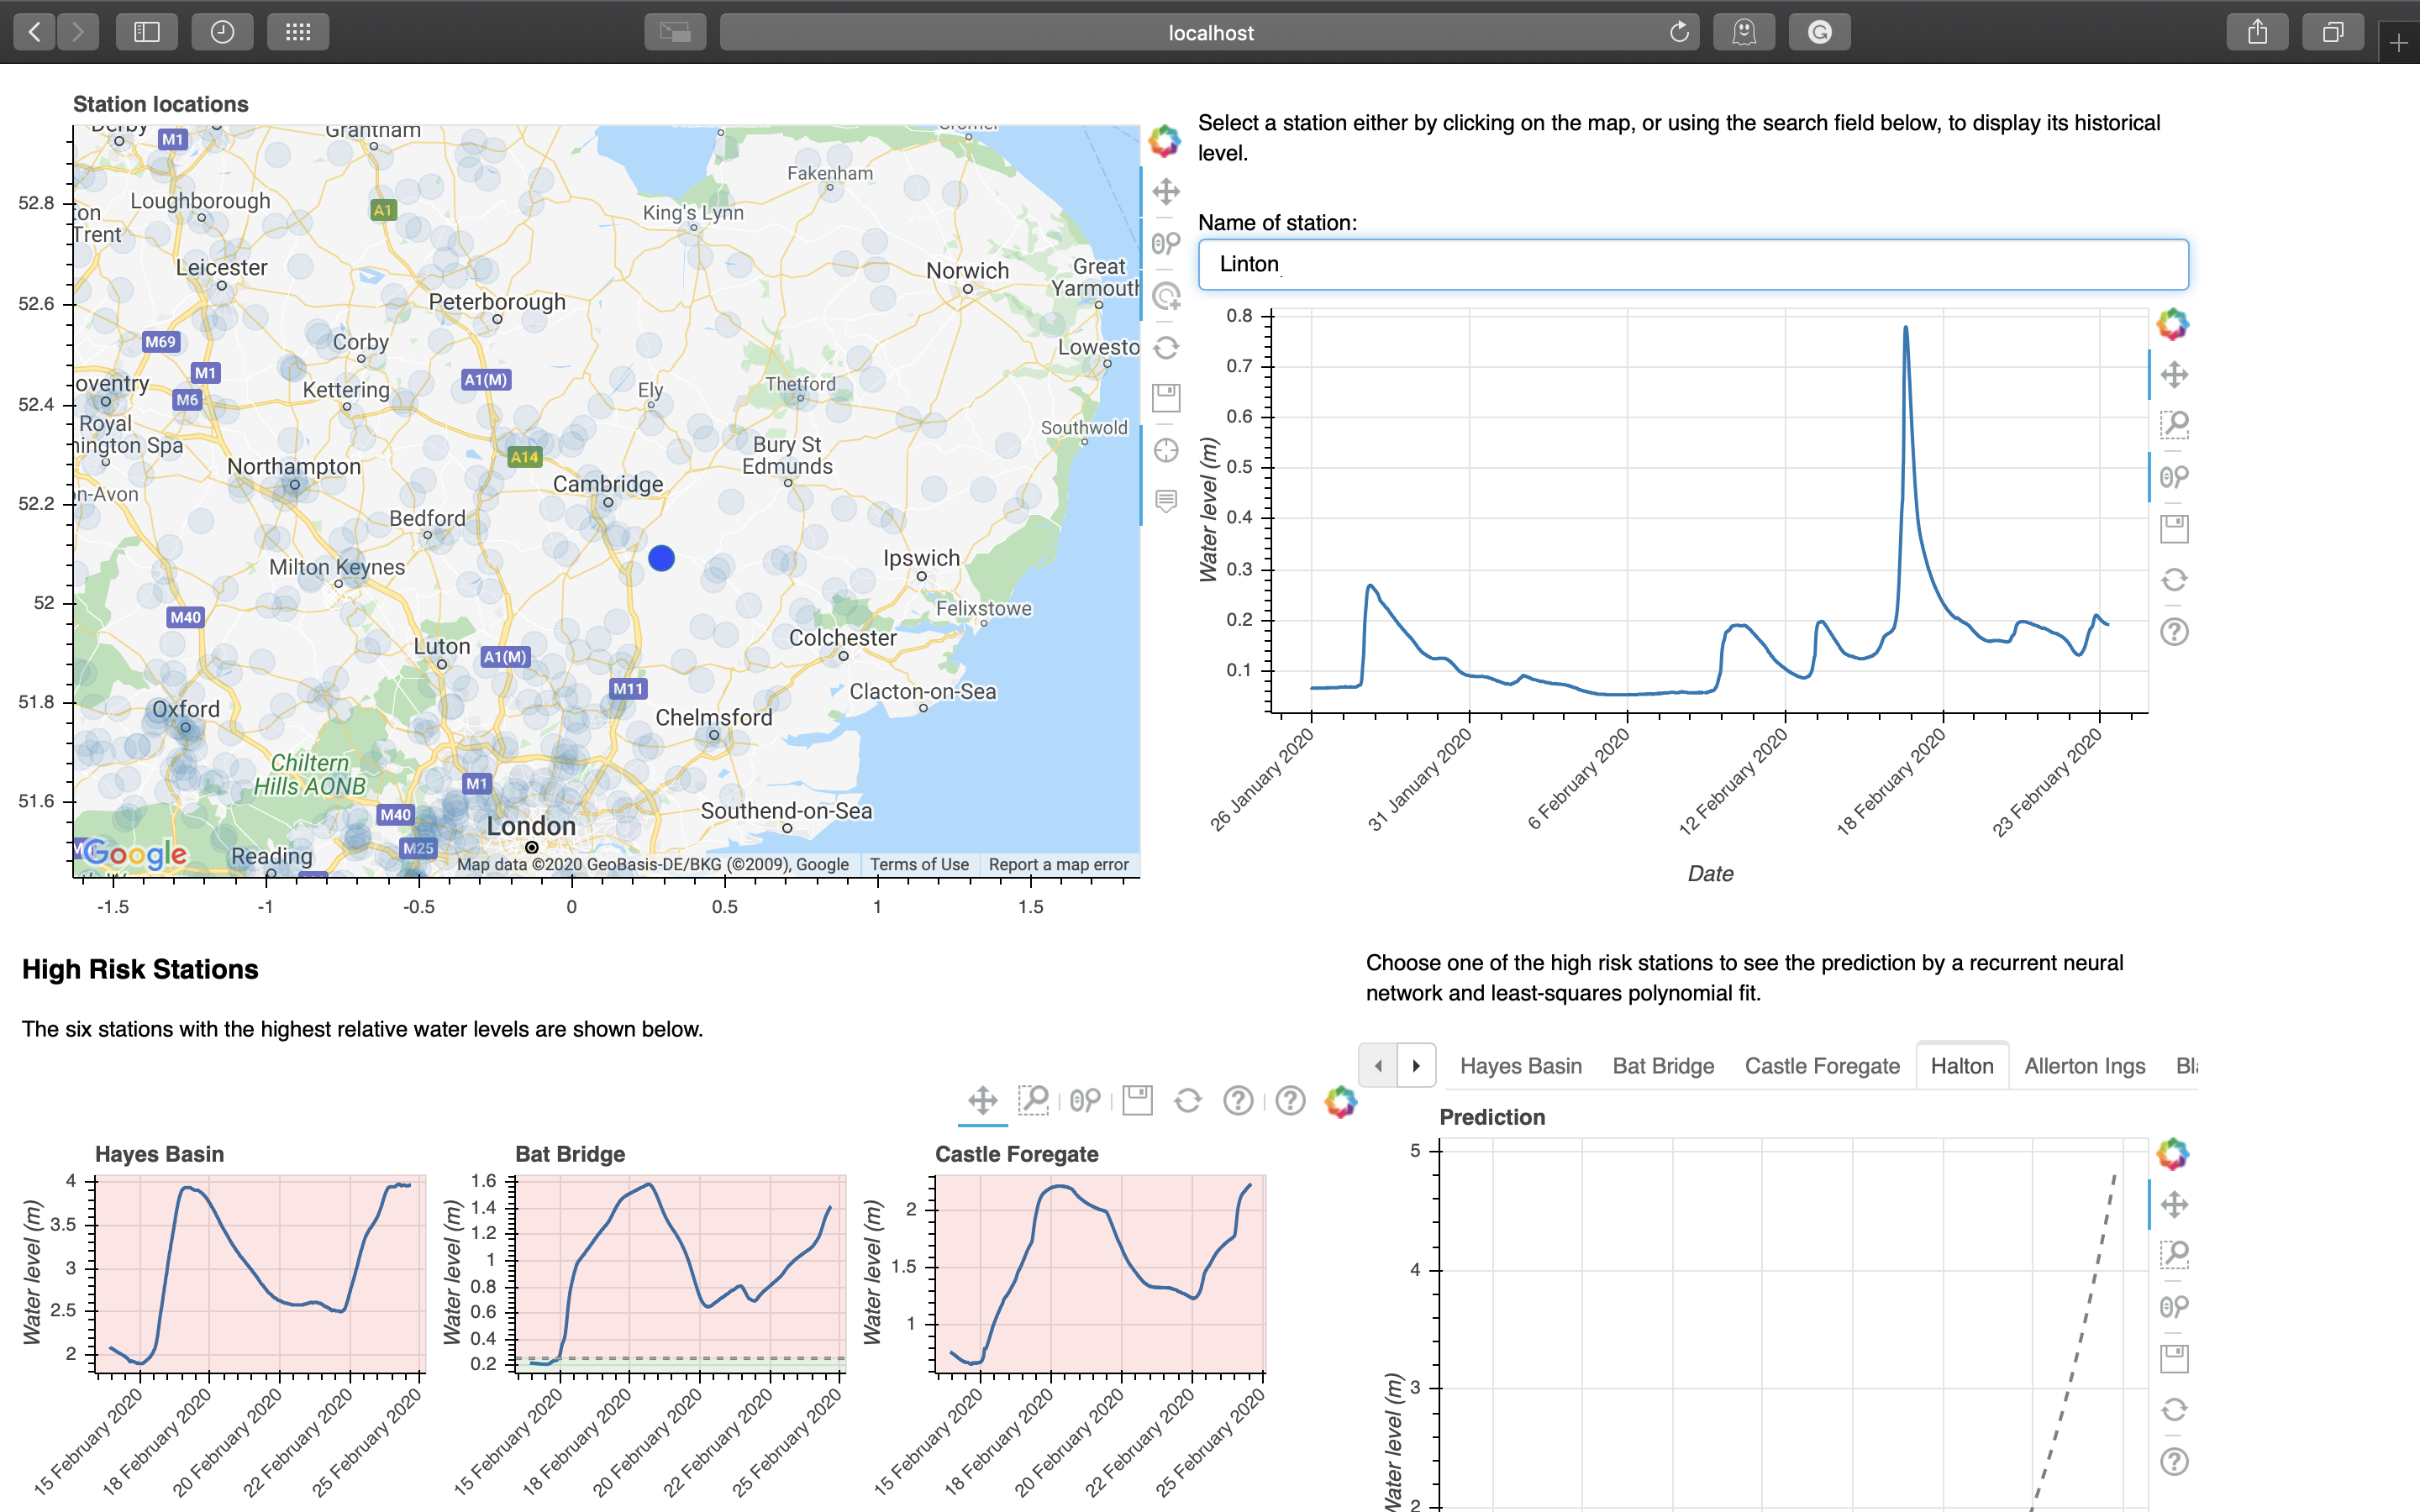
search
Prediction
High risk stations are displayed, and predicted for future changes in water level.
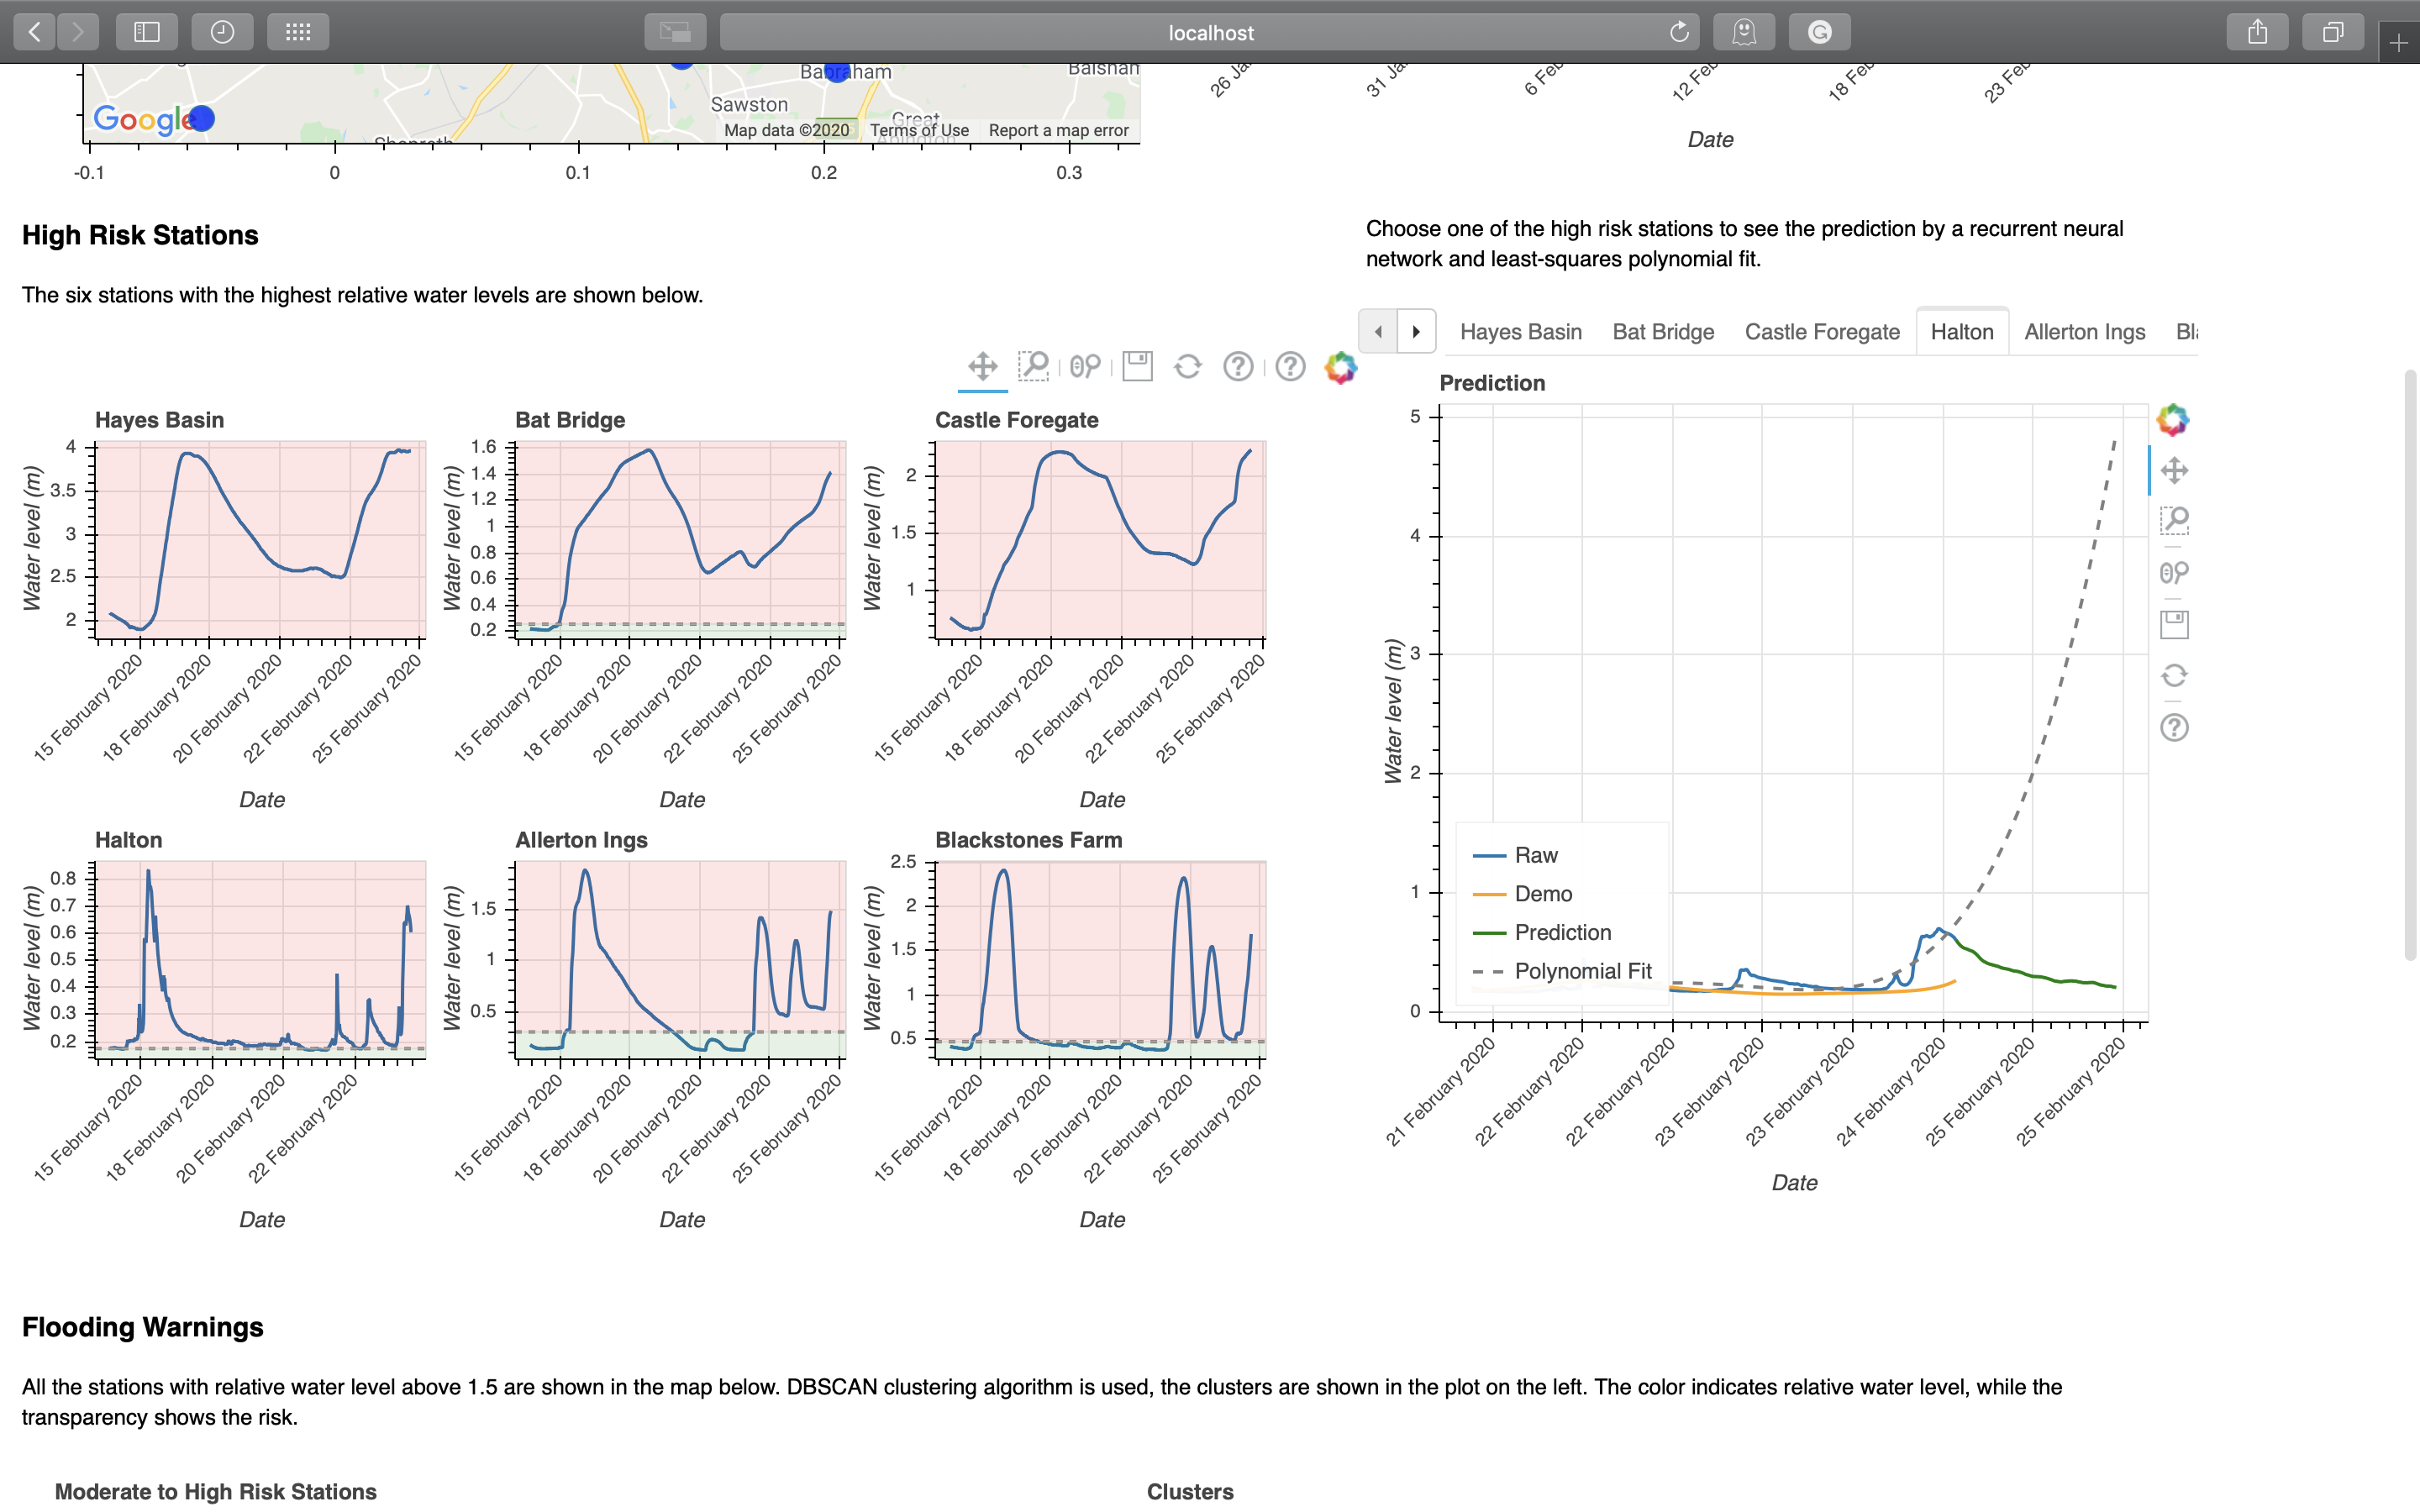
prediction
The prediction is done both using a least-squared polynomial fit and a recurrent neural network. The LSTM network is trained on data obtained by a sliding window, and is applied recursively to predict future water levels. This is implemented in floodsystem.predictor submodule.
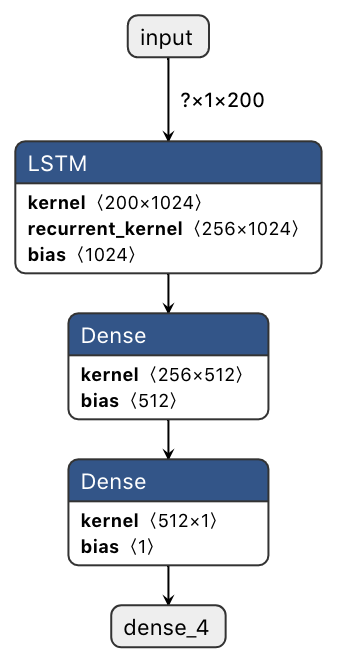
network
As can be seen from the above figure, RNN produces more realistic predictions, especially on periodic and exploding data.
The prediction is run in a different thread to the main interface, allowing the rest of the interface to be loaded quickly. The progress of prediction is displayed when it is running.
Warning
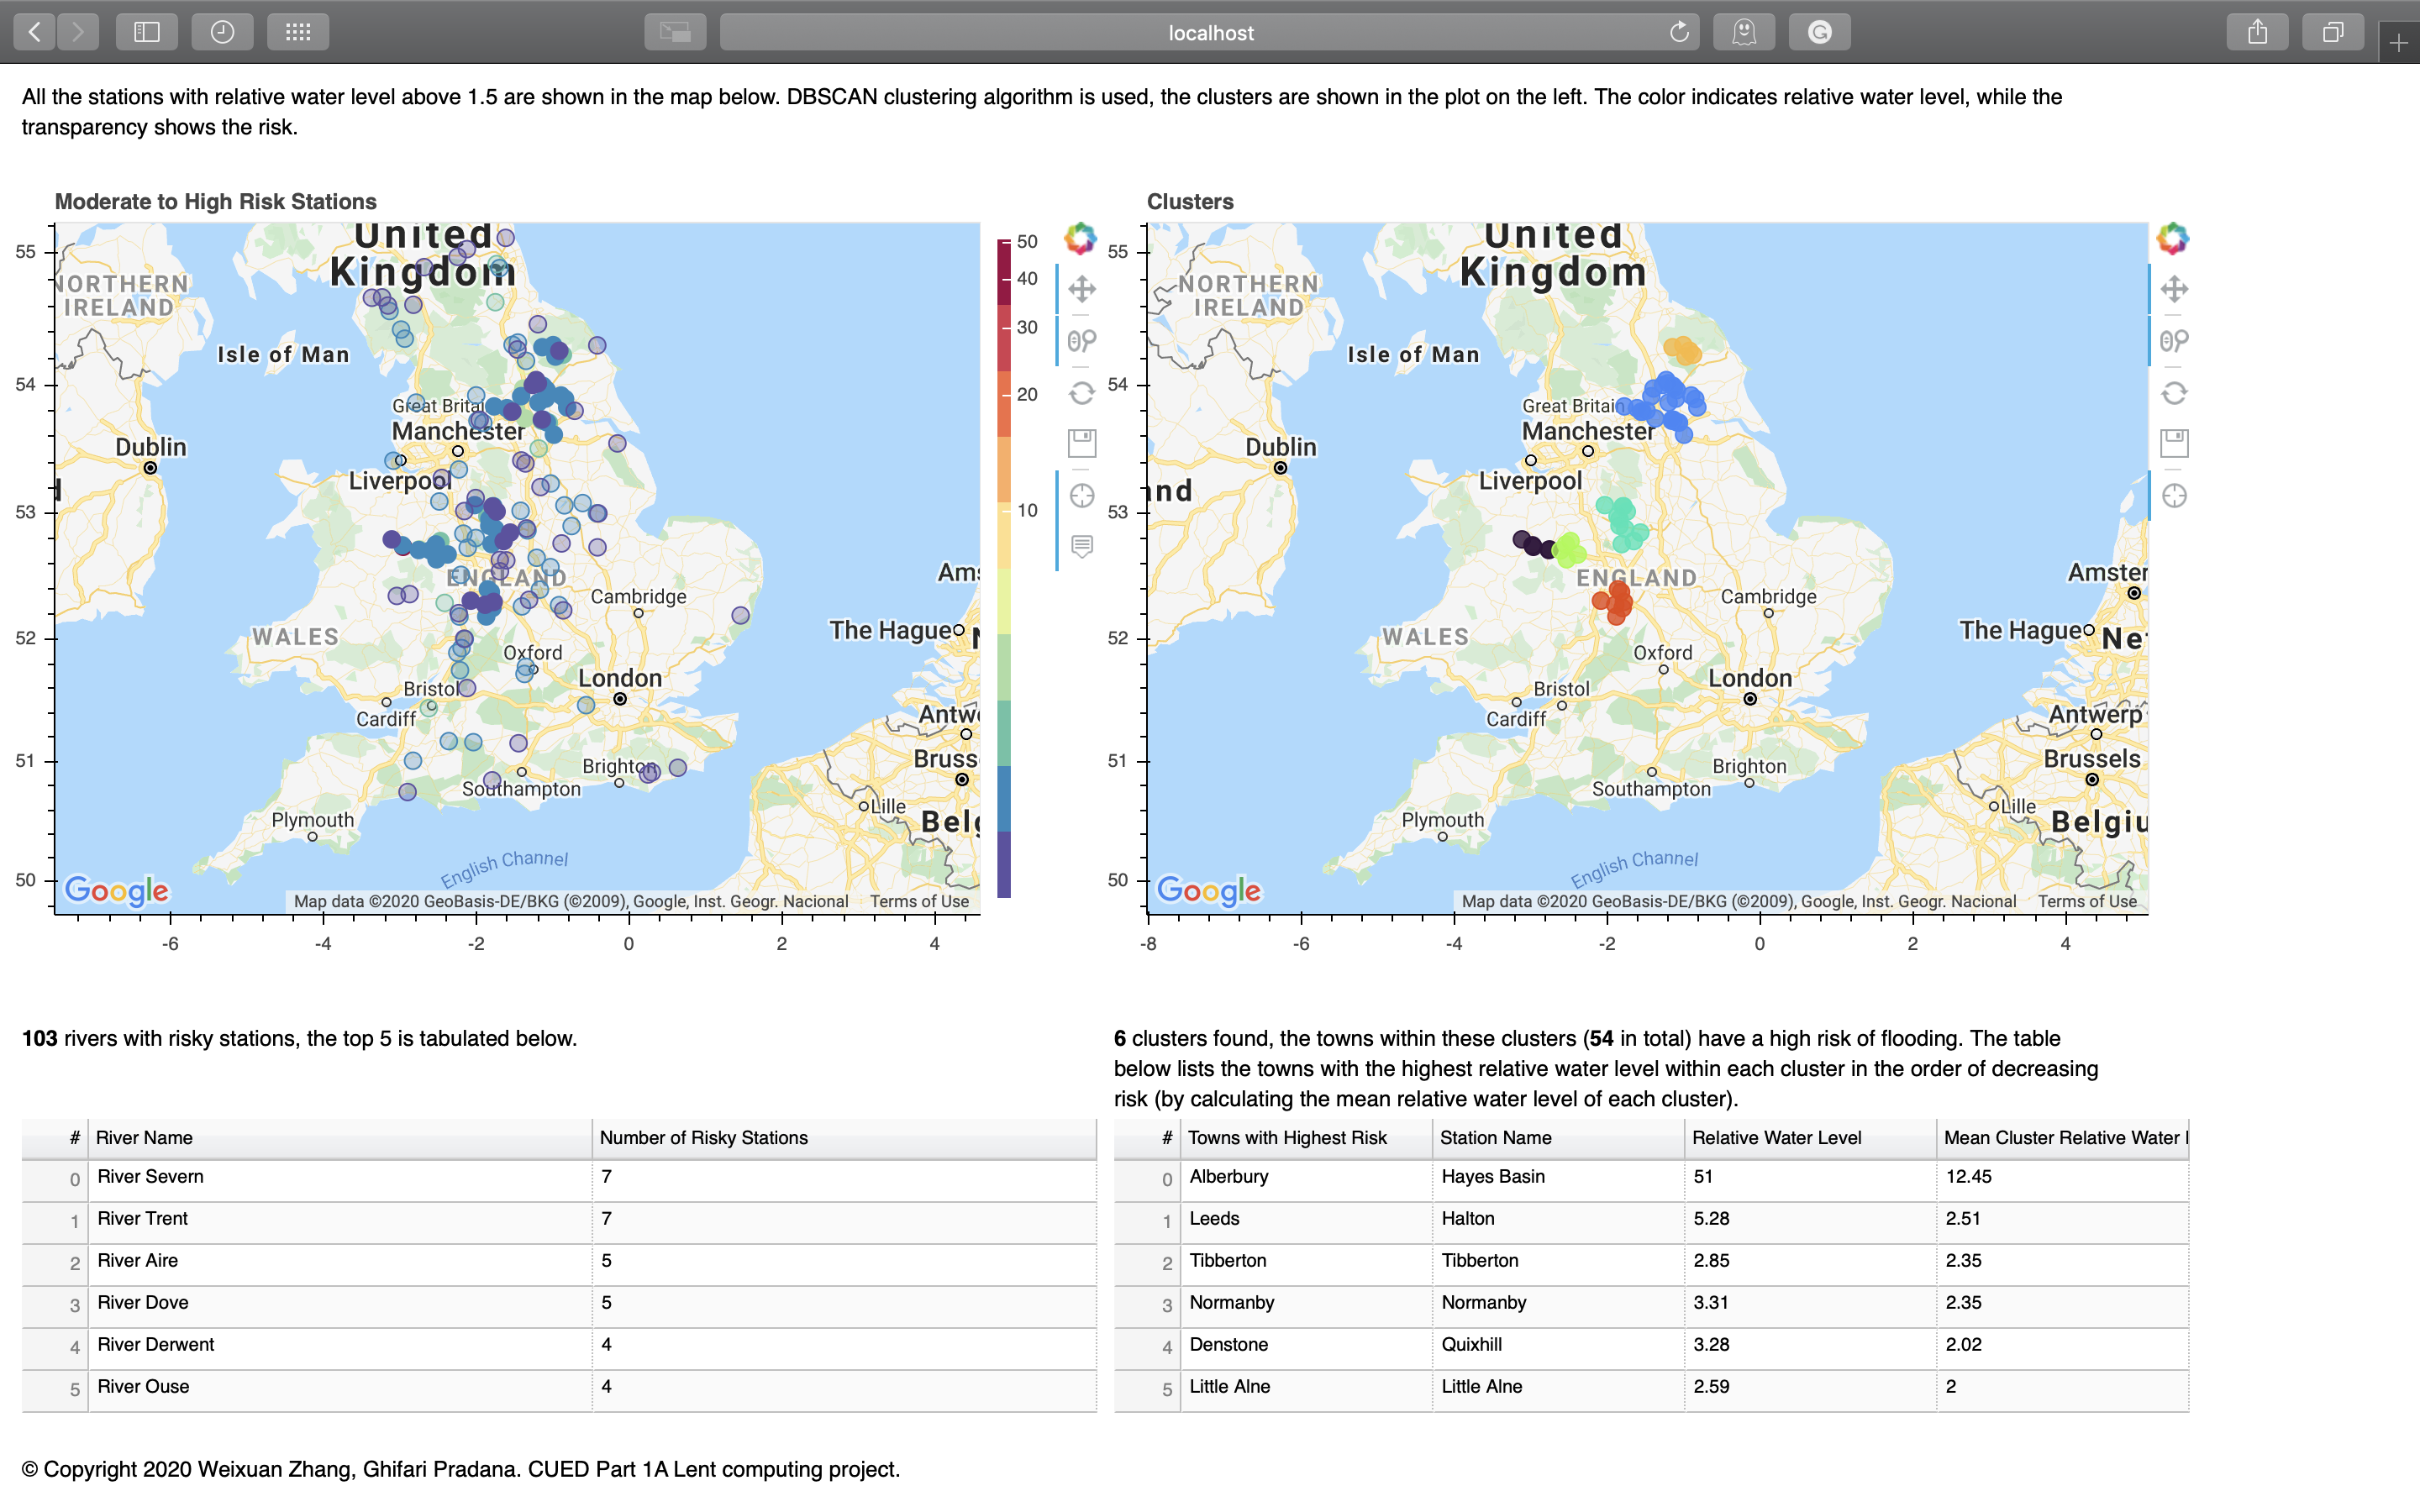
When considering the risk of flooding of a town, stations cannot be considered in isolation, so clustering is used on stations whose latest water level is 1.5 times its typical range above the upper typical range. The clustering algorithm implemented is DBSCAN with haversine distance as the distance metric.
Stations within these clusters are considered as high risks, and are shown on the map with less transparency, while the colours indicate relative water levels.
Then the town with the highest relative water level in each cluster is found, sorted using the mean relative water level of the cluster containing it.
warning
Note
The above sections are converted to reStructuredText from README.md using pandoc.